When deploying business solutions with clients, we often hear requests for custom functionality not supported by core Tableau functionality. When implementing a Tableau dashboard, clients frequently request the ability to write back to a database directly from a dashboard, so that updated data can be immediately analyzed within Tableau. Until recently, this functionality was not possible, and we needed to recommend sub-optimal workarounds that never fully put the power in a user’s hands. With the introduction of Extensions in Tableau Desktop/Server 2018.2, the ability to write back to a database directly from a dashboard by a user is only limited by your creativity (and a good Javascript developer). Although the Extension functionality unlocks a seemingly endless list of possibilities for enhancing your dashboards, we believe one of the most compelling use cases is creating extensions for writeback capabilities that power faster and higher-value business insights from data.
Let’s start by identifying some of the most common and impactful use cases for capitalizing on this new feature.
Creating User-Defined Alternate Hierarchies
Tableau can be a powerful tool for performing what-if analysis by incorporating calculated measures and then adjusting rates to reflect different scenarios. But what if you want to see the impact of a potential organization structure change or other dimensional change? By using an extension, you can create a form to model changes to an organizational hierarchy and save that data to a database. Incorporating the “what-if” hierarchy table with your existing data allows you to see the impact of potential changes without affecting the existing source data.
Building a Collaborative Data Dictionary
An up-to-date, complete data dictionary is an important trait of a high-performance business intelligence application. Often, creating a data dictionary is a step that gets lost in the shuffle of a busy application owner, and is often neglected. Developing a wiki-like data dictionary that is stored in a database and using a Tableau extension to allow users to send updated content directly to the database is a great way to put the power of keeping up a relevant data dictionary in the hands of your users who know that data best.
Adding User Comments to a Dataset
Annotating data in dashboards is a feature that is often requested by our clients. By incorporating comments into a dashboard, Tableau transforms from an easy-to-use data visualization tool to a powerful collaboration tool. A simple comment form that points to a certain intersection of data can be built and stored in a database and linked by an extension, allowing comments to be saved and seen by all users of a dashboard. This also keeps the analysis and tracking of comments in the BI tool and prevents significant amounts of analysis from migrating to Excel and PowerPoint.
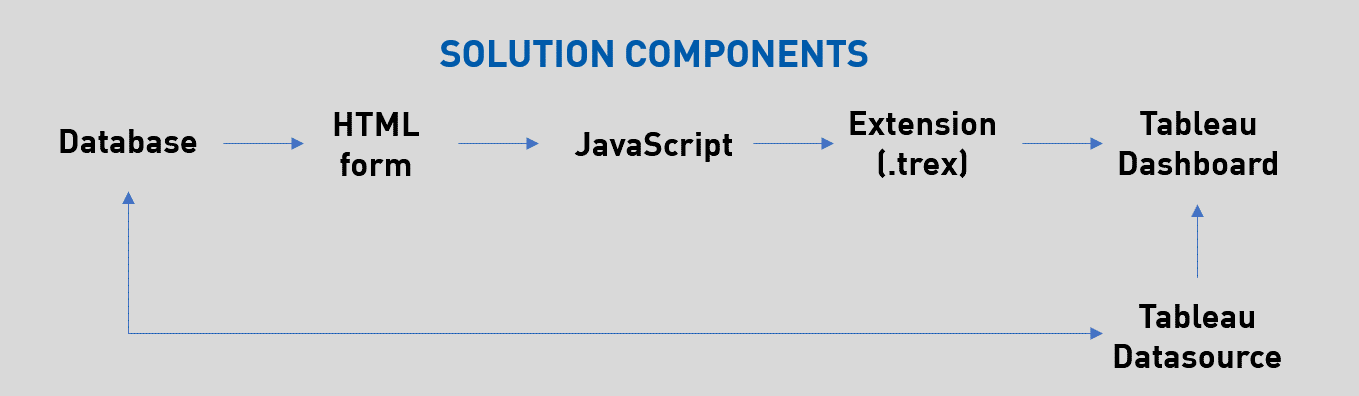
Enough About the Why. Now, let’s focus on the how. Below are the high-level steps to create a writeback extension.
- Database: Create a database table(s) to store the data from your web form
- HTML: Use HTML to create a form to enter the data
- JavaScript: Use JavaScript to develop interactive elements and control sending the data
- .Trex: Create a Tableau manifest file (.trex) that references your new web form
- Add .Trex to Dashboard: Add the .trex file to your dashboard to expose the web form
The diagram below illustrates the components involved in the solution. The source code used in this exercise has been published to Github here.
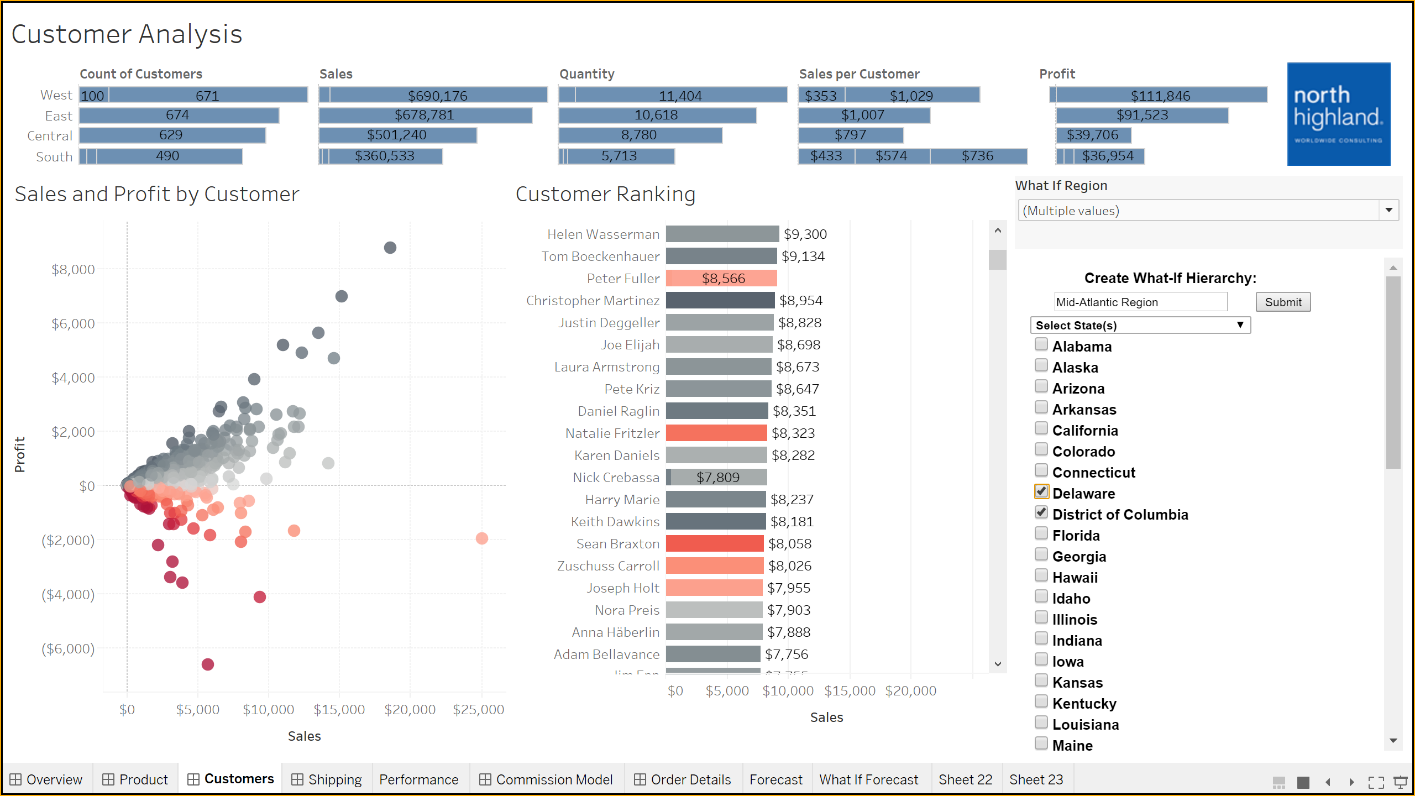
The screenshot below shows the customer input form embedded in the dashboard. In this example, the user can create a new Region and select states to be included. Usually, this type of data modeling would be performed by an administrator prior to being made available in the dashboard. With Extensions, this step can now be performed by the user on-demand.
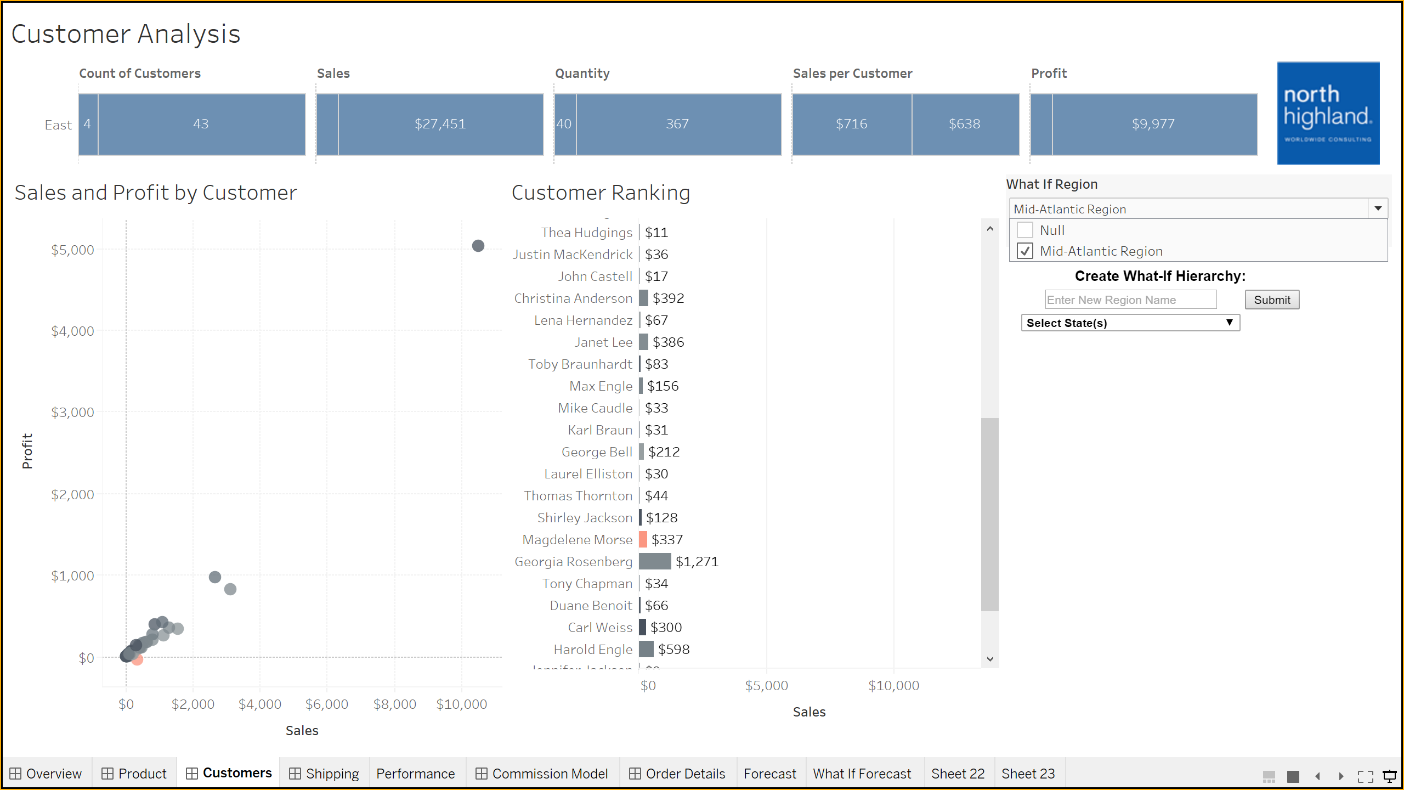
In this screenshot, the results of the new what-if region/state combination are displayed, allowing immediate analysis of the user-defined hierarchy.
With the launch of Extensions, Tableau has created a simple, yet powerful, way to increase the business value and level of insight from your dashboards. The examples we’ve shared today are only the tip of the iceberg to the possibilities opened up by this new feature. For additional ideas, please see the Tableau Extension Gallery and the Developer Community page